Energy test guide · verified October 2, 2026

Bill analysis: the ground truth every projection should start from

Your last twelve months of gas and hydro bills are a measurement instrument you already paid for. Split into baseload versus heating, normalized for weather, and benchmarked against similar homes, they tell you where the money actually goes — and they're the yardstick that later proves whether your upgrades delivered. Our planner does the rough cut in your browser; your advisor's model refines it.

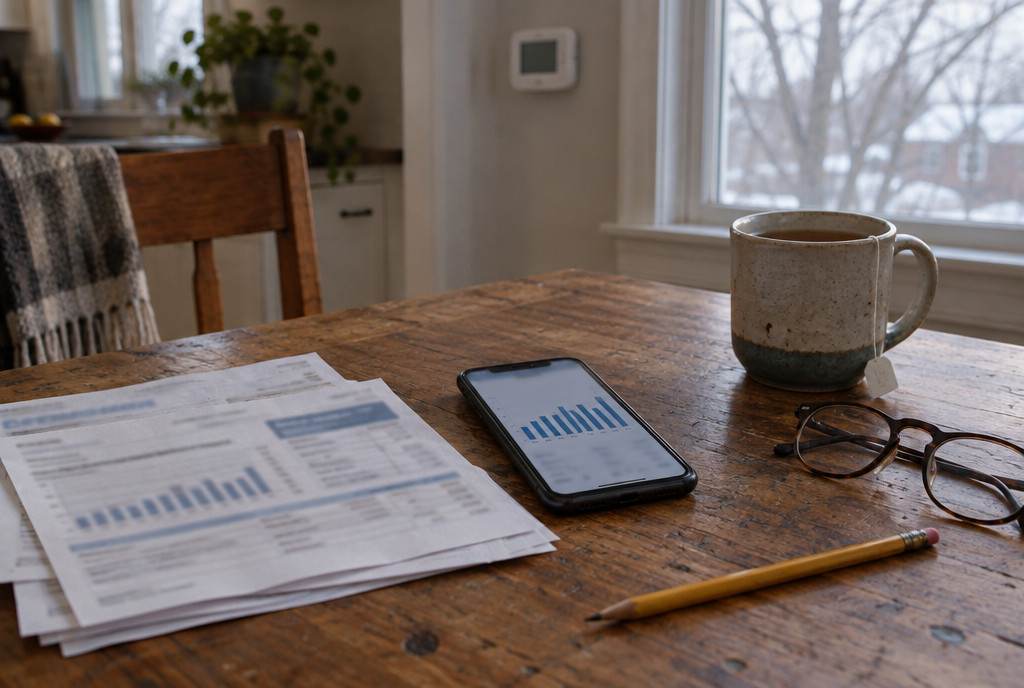
Utility bills and a phone showing a monthly energy-use chart on a kitchen table

Cost

Free — bring the bills

Splits

Baseload vs heating

Method

Weather-normalized

Role

The savings yardstick

What's involved

  1. Pull 12 months of both fuels

    Utility web portals export usage history in a click — kWh by month, m³ of gas by month. Twelve months minimum so both seasons are in the data; twenty-four is better because it averages a mild winter against a hard one.

  2. Find your baseload

    July gas use is your water heater and stove — that's gas baseload. The overnight-summer floor on hourly hydro data (Ontario smart meters expose it in your utility portal) is your always-on electrical load: fridges, freezers, pumps, standby electronics.

  3. Isolate the heating share

    Winter usage minus baseload is what you pay to fight the weather. For most older Ontario homes this is the dominant slice — which is why envelope and heating upgrades headline the plan.

  4. Normalize for weather

    Dividing heating energy by the winter's heating degree-days makes years comparable — so a mild February doesn't masquerade as savings, and a brutal one doesn't hide them. This is the step that separates analysis from anecdote.

  5. Benchmark and set the yardstick

    Your per-degree-day, per-square-metre numbers land somewhere against similar homes — the planner's rough benchmark or your advisor's database. Whatever you upgrade next, this baseline is how you'll know it worked: same math, next winter.

How to get it done

Do the rough version yourself in the planner (it seeds typical figures for your home's size and era, and your real bills sharpen it). Then bring the actual bills to your EnerGuide assessment — the advisor's model ties them to the blower door number and envelope data, which is where projections stop being brochure numbers.

If it finds a problem: your remediation options

The analysis points at one of two problems, each with its own moves:

Often $100s/yr found

High baseload: go hunting

The 25-year-old basement beer fridge, the chest freezer serving six items, a dehumidifier running 24/7, pool and well pumps, electric water heating on the wrong schedule. A $30 plug meter convicts suspects one at a time.

The planner's job

High heating share: run the sequence

Air sealing, insulation, then right-sized equipment — the whole retrofit path this site maps, with the rebates that currently apply. The bill analysis is what proves the sequence worked, winter over winter.

Free to try

Rate-plan optimization

Ontario's time-of-use and ultra-low-overnight plans reward shiftable loads — EV charging, water heating, laundry. The right plan depends on your pattern, which the hourly data reveals.

At replacement

Water heating, the forgotten slice

If summer gas or a big electric baseload traces to hot water, a heat-pump water heater or a better schedule is a real line item — sized and sequenced at your next replacement, not as a panic purchase.

One discipline: change one thing at a time where you can, and re-read the normalized numbers after. The houses that actually get cheaper to run are the ones where somebody kept score.

Cost figures are Ontario planning bands as of October 2, 2026 — quotes vary with the house; use them to budget, not to negotiate.

Common questions

My neighbour's bills are lower. Is my house worse?

Maybe — or they're two people to your five, keep it at 19°C, cook less, and sit on a different rate plan. Occupancy and behaviour swamp house differences until you normalize; that's why the analysis compares per-degree-day intensity against similar homes rather than raw bills over the fence.

How accurate is the planner's version?

Deliberately rough: it seeds typical figures for your era and size, and your real bills tighten it into a fair estimate of your split and likely savings ranges. The advisor's model — fed by your blower door number and envelope data — is the version to make purchase decisions on.

Can I see my baseload without any math?

Mostly, yes: Ontario utility portals expose hourly smart-meter data — look at 2–5 a.m. on a mild summer night and you're staring at your always-on load. If that floor is high, the hunt (old fridge, pumps, dehumidifier) almost always finds the culprit within an afternoon.

Bring the bills, sharpen everything

Run the planner with your bills, then let us match you with an advisor whose model turns them into a plan with numbers you can hold it to.

Email us what you’re planning, your postal code and the type of building (a house, a duplex or triplex, or a larger multi-unit building) — we’ll reply with registered service organizations for your area and which rebates apply.

Email dave@clickshift.ca

This inbox is answered by a person. Participating advisors pay us a referral fee — you pay nothing, and it never affects the directory.